Abstract
Introduction: t(11;14) is a common cytogenetic abnormality found in ~15% of patients (pts) with MM. Although t(11;14) is historically associated with favorable or neutral outcomes in MM (Sawyer2011; Moreau 2007), it has been associated with poor prognosis in retrospective analyses (Leiba 2016; Fonseca1998). A recent matched cohort study suggested that pts with t(11;14) may have inferior outcomes (Lakshman 2017). Previous reports show higher incidences of MM and a disparity in treatment outcomes for AA vs NAA pts (Bhatnagar 2015; Waxman 2010). Connect MM is the first and largest US-based prospective, observational, multicenter registry that collects data on management and natural history of NDMM pts in clinical practice. Here, we compared the baseline characteristics, type and duration of induction, and response and survival outcomes in AA and NAA NDMM pts with and without the t(11;14) abnormality enrolled in Connect MM.
Methods: Adult NDMM pts enrolled in Cohorts 1 and 2 of Connect MM (NCT01081028) who completed induction and were tested for t(11;14) by FISH/cytogenetics were grouped by race (AA vs NAA). This hypothesis-driven analysis was initiated based on clinical insights. Endpoints were response, progression-free survival (PFS) and overall survival (OS). Kaplan-Meier analyses of PFS and OS were adjusted for differences in cohort, age, ISS stage, transplant intent, t(4;14), hemoglobin, platelets, calcium, creatinine, and diabetes history. Response data were investigator-reported. The data cutoff date was Nov 9, 2016.
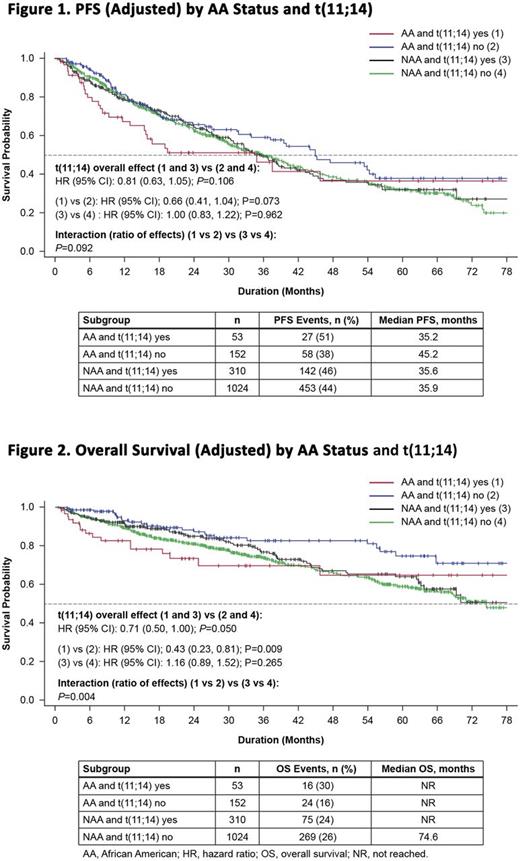
Results: Of the 3011 pts enrolled 1539 (52%) were tested for t(11;14); of these, 363 (24%) were t(11;14)-positive, including 53/205 (26%) of AA and 310/1334 (23%) of NAA pts (P=0.373). Abnormal serum-free light chain levels were found in 68% of AA pts vs 71% of NAA pts with t(11;14); 34% of AA pts and 22% of NAA pts with t(11;14) had serum creatinine levels >2.0 mg/dL, and 66% and 77% had serum creatinine levels ≤2 mg/dL. More NAA pts experienced pathological fractures at baseline compared with AA pts with t(11;14) (40% vs 23%). Compared with NAA pts with t(11;14), AA pts with t(11;14) had numerically higher rates of baseline anemia, history of MGUS, smoldering myeloma, diabetes, and hypertension. The most common induction regimens for AA and NAA pts with t(11;14) were similar: lenalidomide (LEN), bortezomib (BORT), dexamethasone (DEX; 30% vs 30%, respectively); BORT, DEX (25% vs 17%); BORT, cyclophosphamide, DEX (15% vs 16%); LEN, DEX (9% vs 12%), and BORT alone (0% vs 3%). The median duration of induction treatment was similar (4.5 mo [range, 2.5-5.6] and 4.4 mo [3.0-7.5]) for all AA and NAA pts with t(11;14). The frequency of post-induction stem cell transplant (SCT) was similar between the two cohorts (36% vs 37%). The median number of treatment courses and regimens were similar between AA and NAA pts. Using clinician-reported best response during induction phase, AA pts with t(11;14) achieved lower ORR (34%) compared with AA without t(11;14) (45%) or non-AA pts with t(11;14) (42%). Moreover, the CR and ≥VGPR rates for AA vs NAA pts with t(11;14) were 2% vs 14% and 15% vs 28%, respectively. AA pts with t(11;14) showed a trend towards shorter median PFS compared with AA pts without t(11;14) (HR [95% CI]: 0.66 [0.41, 1.04]; P=0.073) (Figure 1). AA pts with t(11;14) had a significantly shorter median OS compared with AA pts without t(11;14) (HR [95% CI]: 0.43 [0.23, 0.81]; P=0.009) (Figure 2). Early mortality, defined as death within 6 mo, also appeared higher for AA pts with t(11;14). Presence of t(11;14) was not associated with any effect on PFS or OS in NAA pts (Figures 1 and 2). For OS, the interaction between race and t(11;14) status was statistically significant (P=0.004). Our analysis is limited by the small patient numbers in the AA t(11;14) subgroup.
Conclusions: In Connect MM, t(11;14) appears to be an independent, negative prognostic factor for OS in AA pts compared with NAA. These differences were seen despite these pts having similar induction regimens, SCT rates, and overall length of treatment. This observation could, in part, be attributed to differences in baseline characteristics between the two race groups. Although certain baseline features were noted to be different between AA and NAA, the analysis was adjusted for these factors. A trend toward shorter PFS was observed in AA vs NAA pts with t(11;14). There was no association between t(11;14) and survival outcomes in NAA pts.
Gasparetto: Celgene: Research Funding; Janssen, BMS, Celgene, Takeda: Honoraria; Janssen, BMS, Celgene: Other: Travel, accommodations, or other expenses paid or reimbursed; Janssen, BMS, Celgene: Consultancy. Abonour: Celgene: Other: Steering committee, Research Funding; Takeda: Other: Steering committee, Research Funding; Prothena: Research Funding. Jagannath: Medicom: Speakers Bureau; Celgene: Consultancy; Bristol-Meyers Squibb: Consultancy; MMRF: Speakers Bureau; Novartis: Consultancy; Merck: Consultancy. Durie: Janssen: Consultancy; Takeda: Consultancy. Narang: Janssen: Speakers Bureau; Celgene: Consultancy, Speakers Bureau. Terebelo: Pharmacyclics: Speakers Bureau; Takeda: Speakers Bureau; Janssen: Speakers Bureau; Celgene: Consultancy. Toomey: Dava Oncology: Other: Travel; Myriad Genetics: Speakers Bureau; Celgene: Consultancy. Hardin: Celgene: Consultancy. Wagner: Janssen: Consultancy; Gilead: Consultancy; EveryFit: Consultancy. Srinivasan: Celgene: Employment. Kitali: Celgene: Employment. Flick: Celgene: Employment. Zafar: Celgene Corporation: Employment. Agarwal: Celgene Corporation: Employment. Rifkin: Takeda: Consultancy; Sandoz: Consultancy; EMD Serono: Consultancy; Celgene: Consultancy; Boehringer Ingelheim: Consultancy; Amgen: Consultancy; McKesson: Other: Stock.
Author notes
Asterisk with author names denotes non-ASH members.


This feature is available to Subscribers Only
Sign In or Create an Account Close Modal